Case Study 2: TCGA BRCA Data Analysis — Machine Learning and Deep Learning for Breast Cancer Subtype Classification
This case study demonstrates my expertise in genomic data analysis, machine learning, and deep learning. The project involved accessing public genomic datasets from the GDC data portal, performing comprehensive exploratory data analysis, and applying both classical machine learning and deep learning approaches to classify breast cancer subtypes.
Project Background
The Cancer Genome Atlas (TCGA) is a comprehensive, publicly available archive of genomic data from over 20,000 primary cancer and matched normal samples. This project focused on the TCGA-BRCA dataset, which contains RNA-Seq expression data from 885 breast cancer and normal tissue samples.
The primary objective was to:
- Access and prepare large-scale genomic data from the GDC data portal
- Perform exploratory data analysis to understand the underlying structure
- Identify molecular subtypes (PAM50) as a major source of variation
- Apply machine learning and deep learning models to classify samples into breast cancer subtypes
- Compare classical ML (KNN) with deep learning approaches
Dataset Overview
The TCGA-BRCA dataset provides comprehensive RNA-Seq expression data:
- Total samples: 885 samples (primary tumours, metastatic tumours, and normal tissue)
- Gene features: 60,660 genes (raw counts)
- Post-filtering: 18,303 genes (after removing unexpressed genes)
- Molecular classification: PAM50 breast cancer subtypes (basal, her2, lumA, lumB, normal)
Data Access and Preparation
GDC Data Portal Integration
The dataset was accessed through the GDC (Genomic Data Commons) data portal using:
- GDC portal filters to identify TCGA-BRCA samples
- Manifest file generation for batch download
- R-based data loading using
TCGAbiolinkspackage functions GDCdownload()andGDCprepare()to create a SummarizedExperiment (SE) object
Data Structure
The prepared dataset contained:
- Dimensions: 60,660 rows (genes) × 885 columns (samples)
- Data format: SummarizedExperiment object with raw RNA-Seq counts
- Metadata: Sample annotations including tissue type and PAM50 subtype classification
Exploratory Data Analysis (EDA)
1. Data Filtering and Normalization
Raw RNA-Seq counts were processed to prepare for analysis:
- Filtering: Removed unexpressed genes using
filterByExpr()(60,660 → 18,303 genes) - Normalization: Variance Stabilizing Transformation (VST) applied to normalize data and stabilize variance across expression levels
- Output: VST-normalized counts matrix ready for downstream analysis
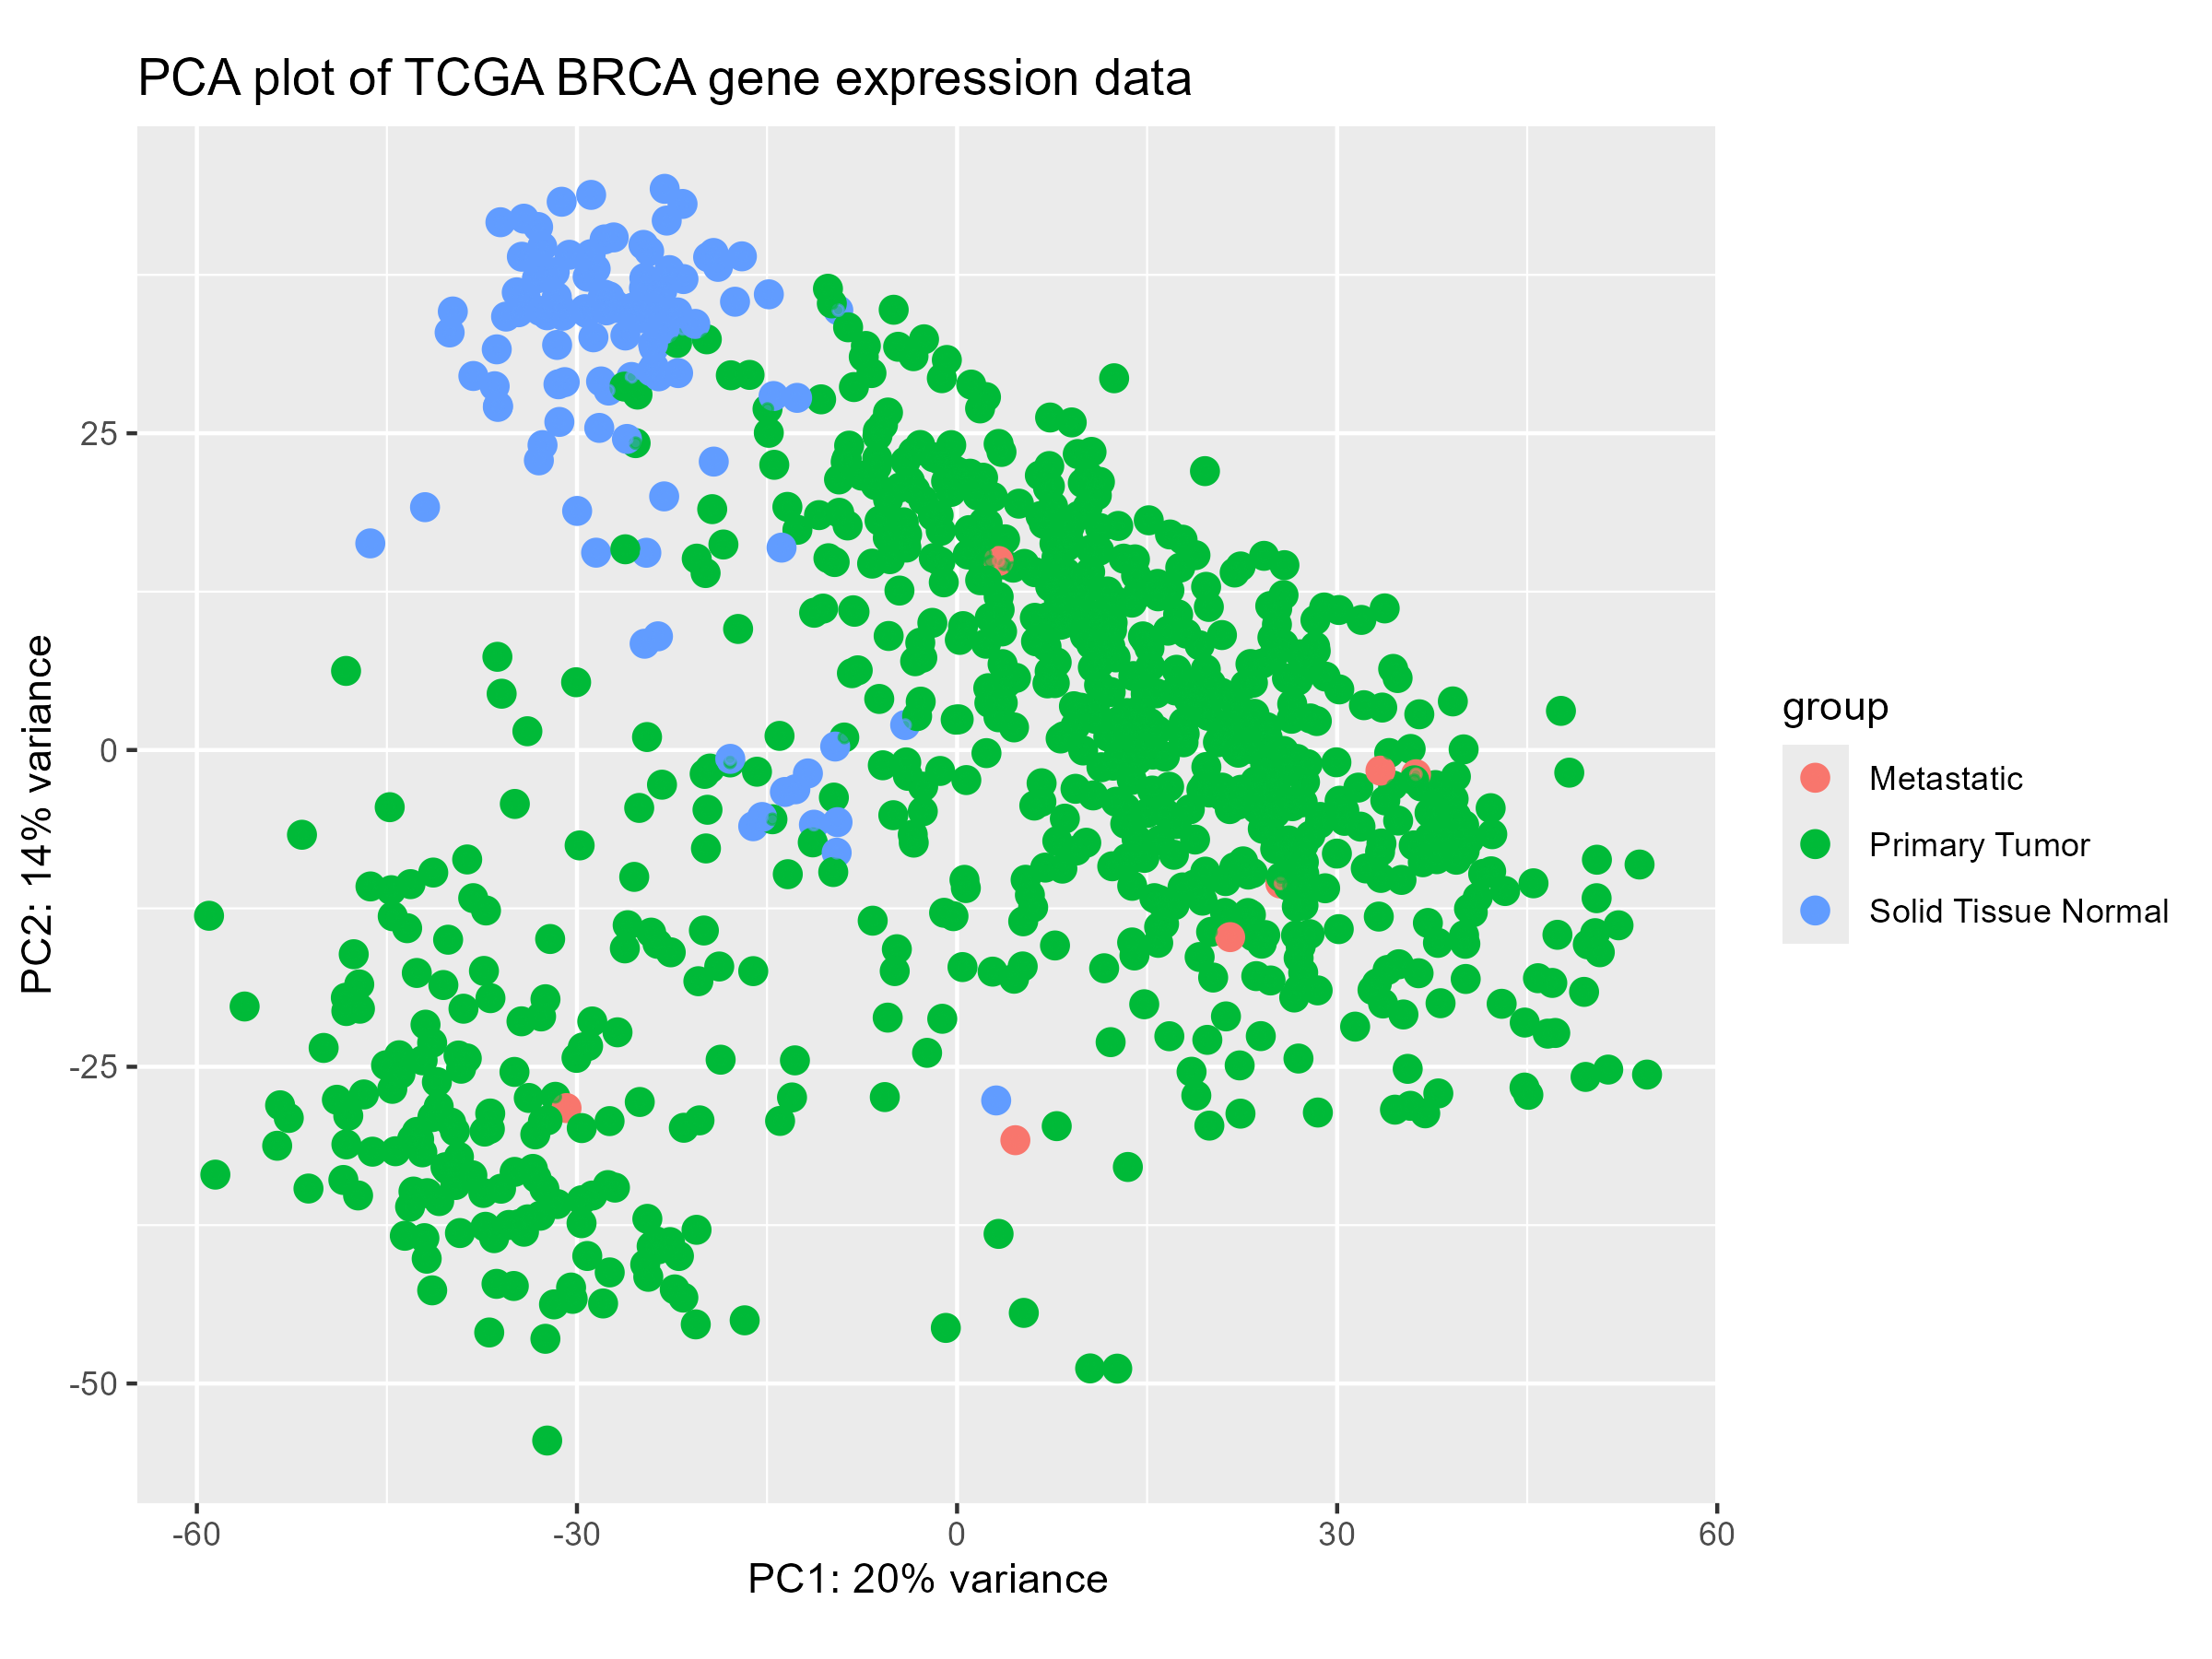
2. Principal Component Analysis (PCA)
PCA was performed to visualize the relationships between samples and identify major sources of variation:
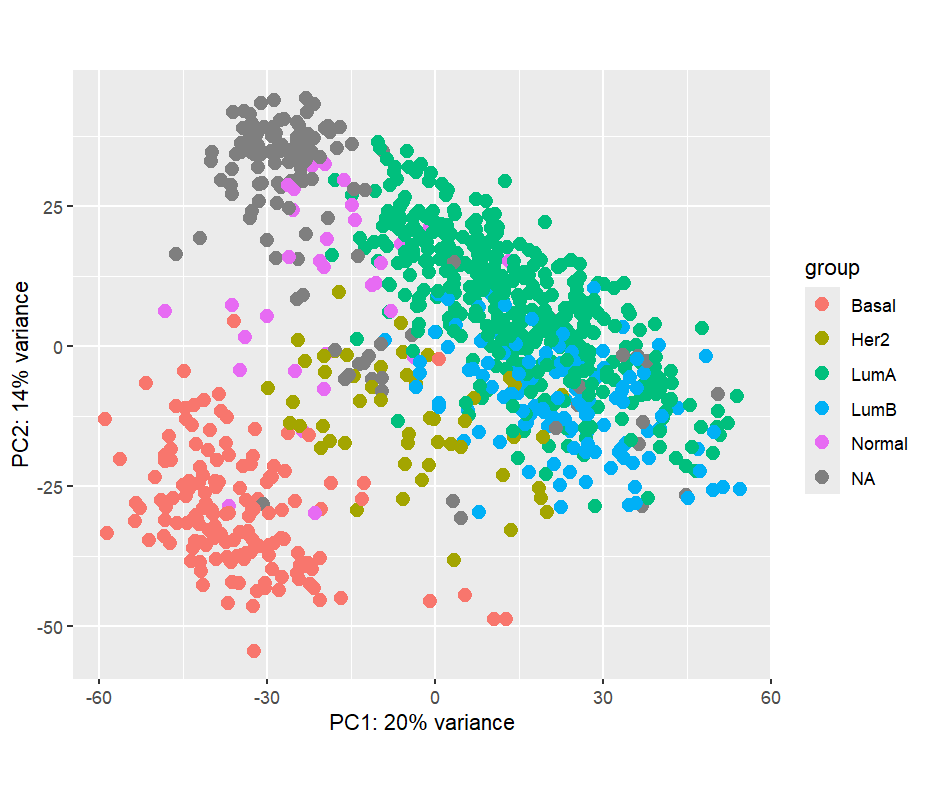
3. PAM50 Subtype Analysis
The PAM50 classification system represents the molecular subtypes of breast cancer. PCA analysis revealed that PAM50 subtype is a major source of variation in the data:
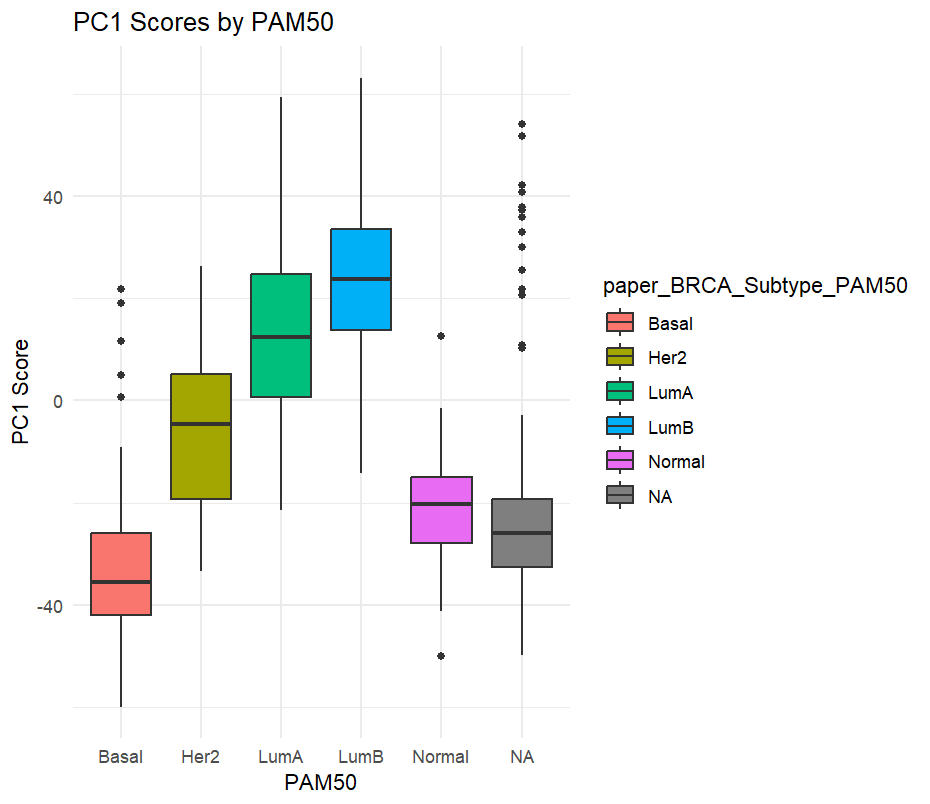
4. PC1 Score by PAM50 Subtype
Box plots revealed significant differences in PC1 scores across different breast cancer subtypes, confirming the strong association between molecular subtype and overall expression profile:
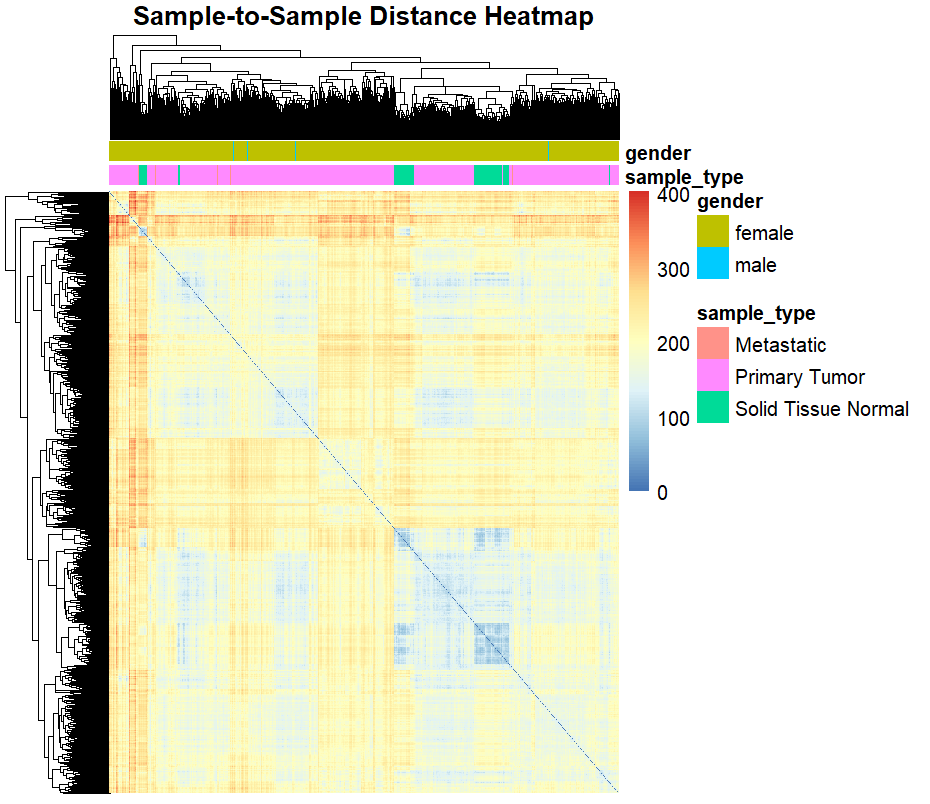
5. Sample-to-Sample Distance Heatmap
A hierarchical clustering heatmap visualized the relationships between all 885 samples based on VST-normalized gene expression:
Machine Learning and Deep Learning Models
Data Preprocessing for Python ML Pipeline
Data prepared in R was transferred to Python for machine learning:
- Matrix transposition: Converted to sample-by-gene format (885 samples × 18,303 genes)
- Metadata integration: PAM50 subtype labels merged with expression data by sample ID
- Normalization: Z-score normalization applied to ensure equal feature contribution
- Encoding: PAM50 subtype labels (basal, her2, lumA, lumB, normal) converted to numerical encoding
- Train-test split: Data divided into training and test sets
1. K-Nearest Neighbours (KNN) Classification
Algorithm: K-Nearest Neighbours is a simple, instance-based classification algorithm.
Application:
- Trained on z-scaled gene expression data
- Target: PAM50 subtype classification (5 classes)
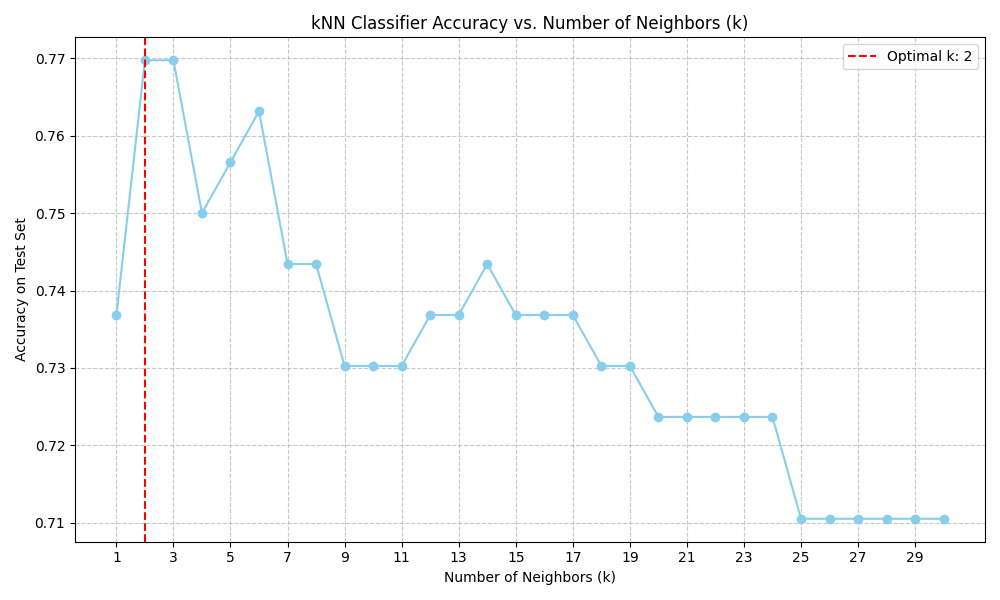
- Hyperparameter tuning: K values tested from 1 to 31
Results:
- Optimal K value: K = 2
- Peak accuracy: 76.23%
- Performance range: 71% - 77% accuracy across tested K values
- Insight: KNN demonstrates reasonable performance, with the optimal K suggesting that nearest neighbors are informative for subtype classification
2. Deep Learning Model (Multi-Layer Perceptron)
Architecture: A neural network designed to capture complex, non-linear relationships in high-dimensional gene expression data:
- Input layer: 18,303 gene expression features
- Hidden layer 1: 256 neurons with ReLU activation
- Hidden layer 2: 128 neurons with ReLU activation
- Output layer: 5 neurons (one per PAM50 subtype) with softmax activation
- Training: 50 epochs with GPU acceleration
- Loss function: Categorical cross-entropy
- Optimizer: Adam optimizer with appropriate learning rate tuning
Results:
- Peak accuracy: 86.84%
- Performance improvement: +10.61% compared to KNN (76.23%)
- Key finding: Deep learning significantly outperforms classical ML for this classification task
- Interpretation: The improved performance suggests that complex, non-linear relationships in gene expression data are better captured by neural networks than by distance-based methods
Key Findings and Conclusions
This comprehensive analysis of the TCGA-BRCA dataset demonstrates several important insights:
1. Data Quality and Structure
The TCGA-BRCA dataset is well-characterized with clear separation between tissue types and strong molecular subtype signals, as evidenced by PCA and clustering analyses.
2. Molecular Subtype as a Major Driver
PAM50 breast cancer subtype is the dominant source of variation in gene expression, explaining a substantial portion of the variance captured by the first principal component.
3. Deep Learning Outperforms Classical ML
The deep learning model (86.84% accuracy) substantially outperformed K-Nearest Neighbours (76.23%), suggesting that non-linear relationships in high-dimensional genomic data benefit from the representational capacity of neural networks.
Technical Methods and Tools
1. Genomic Data Access and Processing (R)
Packages:
TCGAbiolinks- Access GDC data portal and download genomic datasetsDESeq2- Convert raw counts to DESeqDataSet and apply filteringedgeR-filterByExpr()for identifying unexpressed genesggplot2- Publication-quality visualizations (PCA plots, box plots)pheatmap- Hierarchical clustering heatmaps
2. Machine Learning Pipeline (Python)
Core Libraries:
Pandas & NumPy- Data manipulation and numerical operationsScikit-learn- KNN implementation and model evaluation metricsPyTorch- Deep learning model development and trainingScikit-learn.preprocessing.LabelEncoder- Encoding categorical variables
3. Reproducibility
The complete analysis pipeline, including all code for data access, processing, visualization, and machine learning modeling, is available on GitHub for full reproducibility and transparency.
Resources and References
For those interested in exploring this analysis further:
- GitHub Repository - Complete code and analysis pipeline
- TCGA Project Information
- GDC Data Portal - Access the TCGA-BRCA dataset